

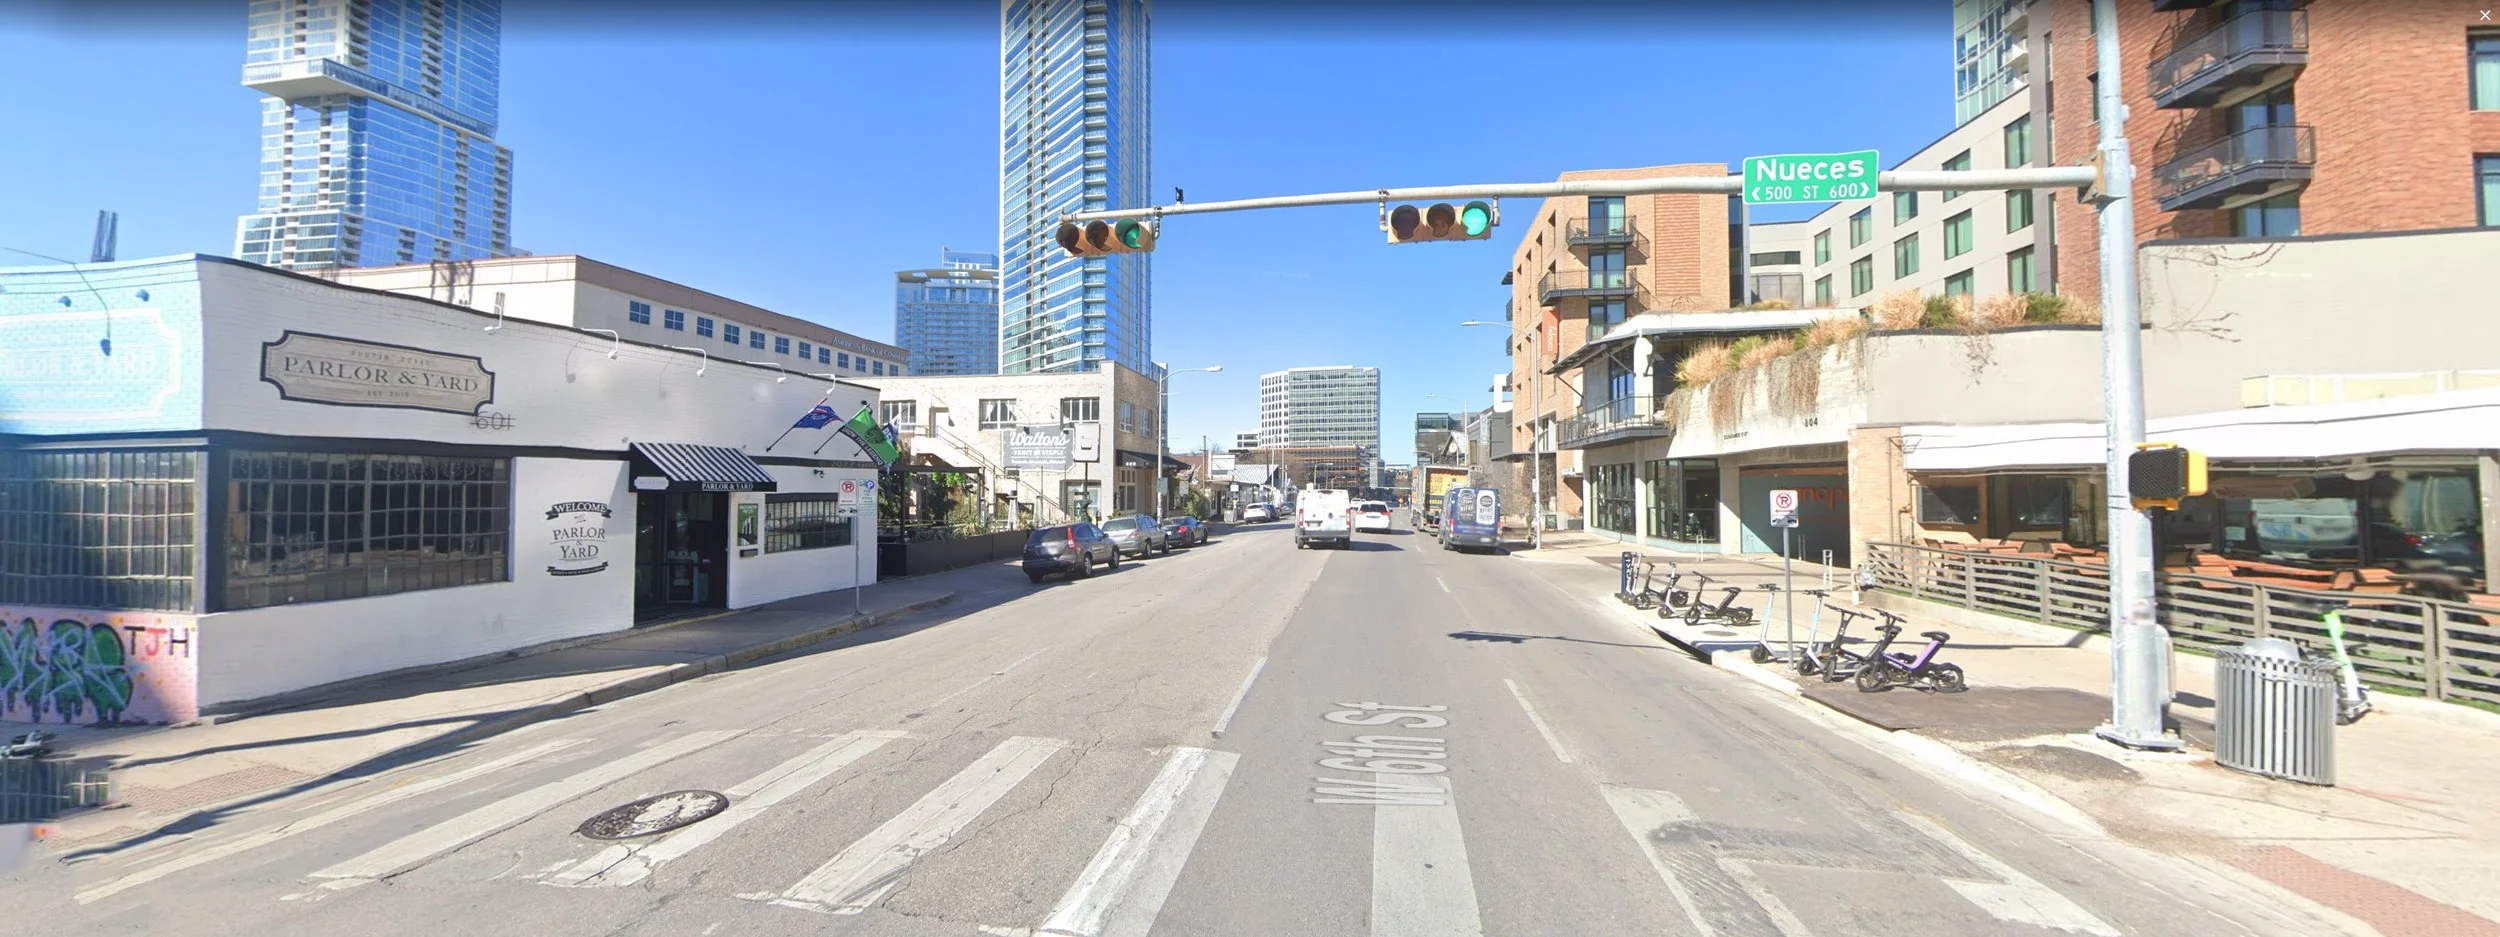
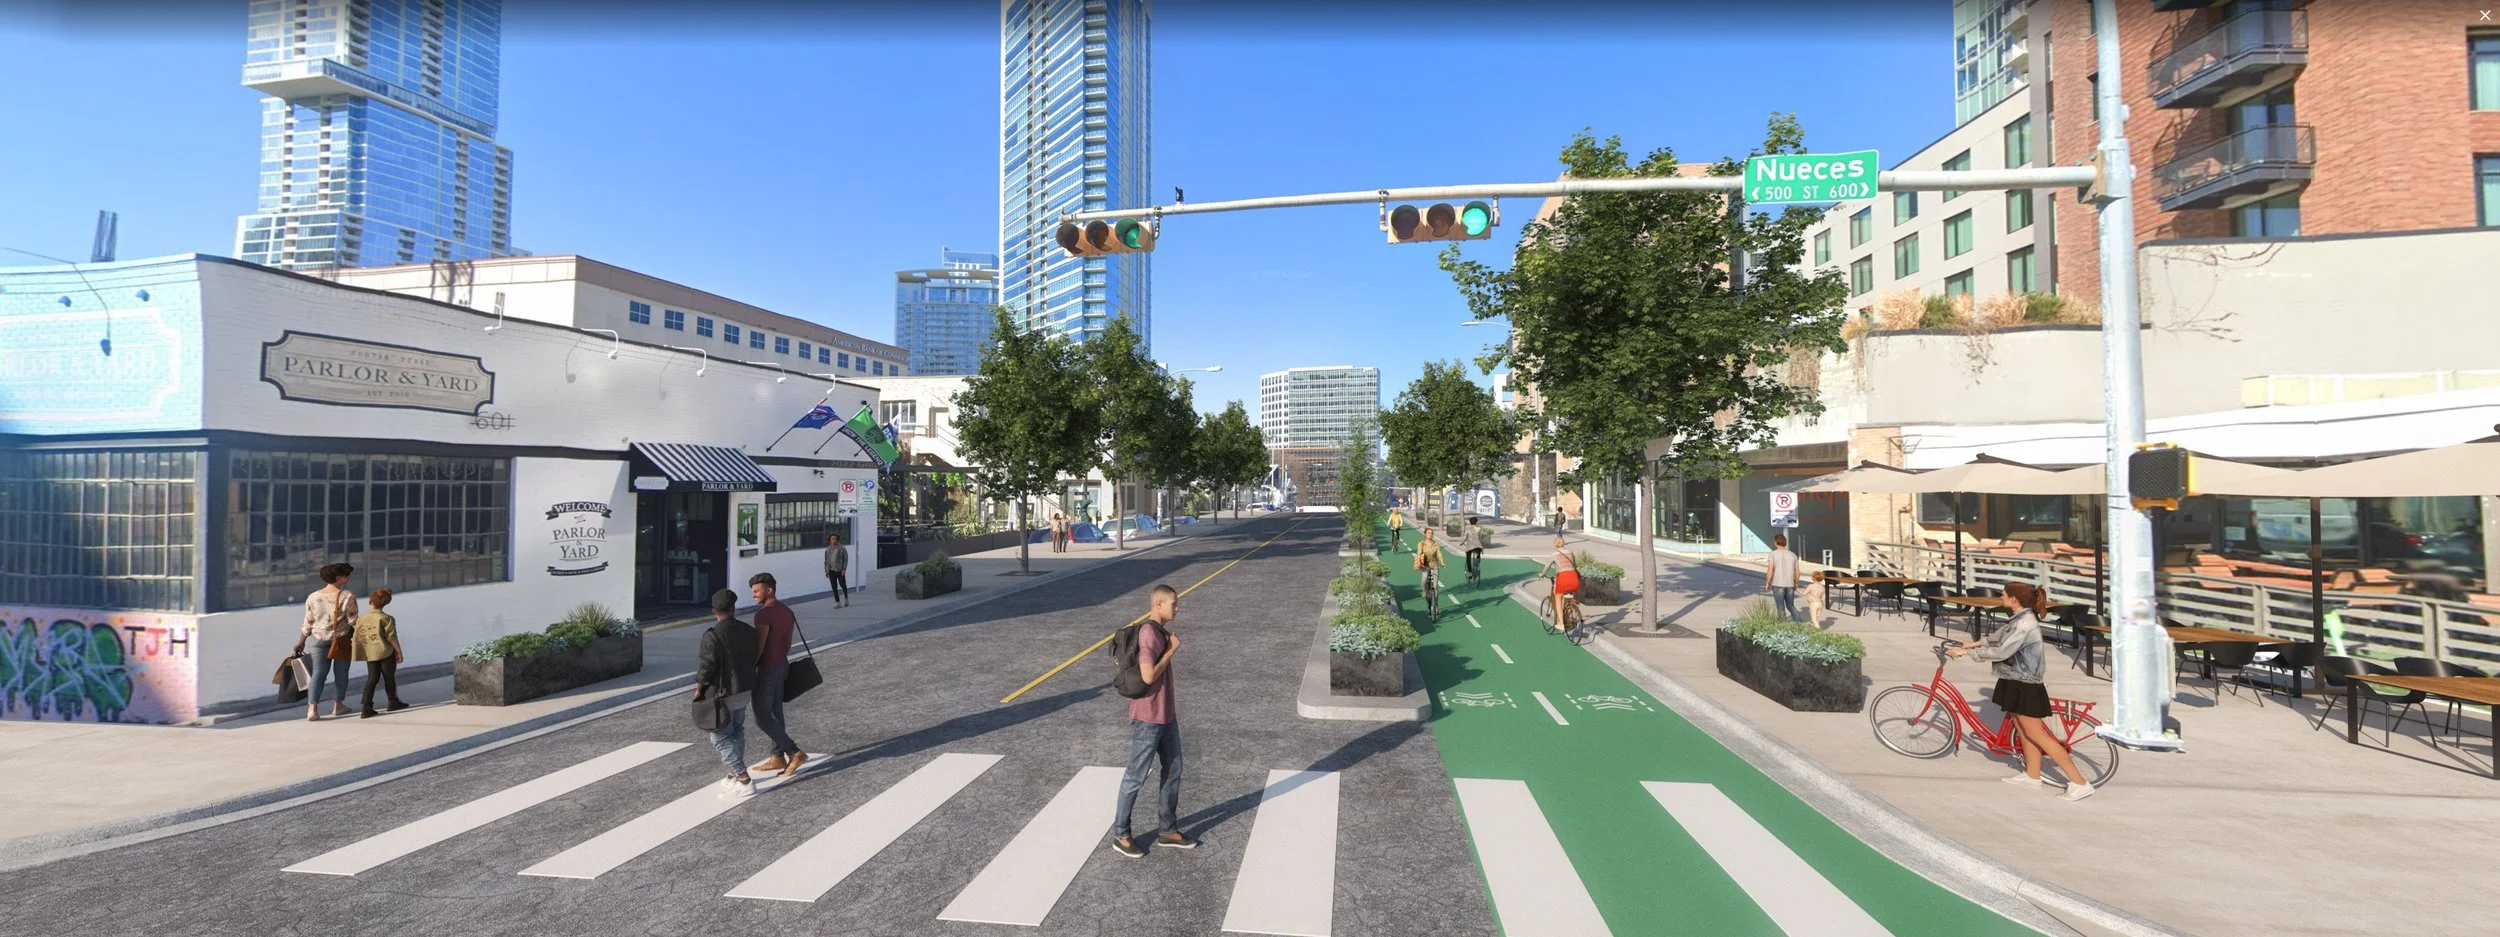
CityLeap ATX: How We Calculated The Numbers
Note: These numbers are approximations to give a sense of the potential benefits of converting one lane on all Austin arterials to bus lanes or protected bicycle lanes. Further study is needed for more accurate numbers.
1,048 tons
of carbon emissions saved each year
$17.8 million
project costs

2 1/4 months
to recoup project costs in crash cost savings to society
Assumption of total annual miles traveled (based on 2019 transportation mode split in Austin Strategic Mobility Plan * Austin population * average trip lengths of 10, 10, 5, 5, and 10 miles respectively for the below modes):
Driving: 7,202,040 miles
Carpool/taxi: 1,430,000 miles
Transit: 194,890 miles
Walking: 97,445 miles
Bicycling: 974,450 miles
Emissions Rates:
Driving alone: 0.45 pounds CO2 per mile
Carpooling/Taxi: Assuming a similar rate as driving alone, 0.45 pounds CO2 per mile
Transit: 0.2 pounds CO2 per passenger-mile
Calculation Steps:
Calculate carbon emissions for driving alone.
Calculate carbon emissions for carpooling/taxi.
Calculate emissions saved by taking transit instead of driving.
Include carbon emissions savings from walking and bicycling.
Calculations:
Carbon emissions from driving alone = (7,202,040 miles * 0.45 pounds CO2/mile) / 2,000 pounds per ton = 325.09 tons CO2
Carbon emissions from carpooling/taxi = (1,430,000 miles * 0.45 pounds CO2/mile) / 2,000 pounds per ton = 64.35 tons CO2
Emissions saved by taking transit instead of driving = (194,890 miles * (0.45 - 0.2) pounds CO2/mile) / 2,000 pounds per ton = 8.76 tons CO2
Carbon emissions savings from walking = Carbon emissions from driving alone = 325.09 tons CO2
Carbon emissions savings from bicycling = Carbon emissions from driving alone = 325.09 tons CO2
Summing up carbon emissions savings for all modes:
Total carbon emissions savings per year = Carbon emissions from driving alone + Carbon emissions from carpooling/taxi + Emissions saved from transit + Carbon emissions savings from walking + Carbon emissions savings from bicycling = 325.09 + 64.35 + 8.76 + 325.09 + 325.09 = 1048.38 tons CO2
Assumptions
Network length: 110 miles
55 miles for bus lanes
55 miles for protected bike lanes
Cost per mile for bus lanes: $100k
Cost per mile for protected bike lanes: $90k
Labor: 20% of total construction cost
Design and engineering: 10% of total construction cost
Equipment and materials: 30% of total construction cost
Other expenses (permits, contingencies, etc.): 10% of total construction cost
Total construction cost
Protected bike lanes: 55 miles * $90,000 per mile = $4,950,000
Bus lanes: 55 miles * $100,000 per mile = $5,500,000
Total construction cost = $4,950,000 (bike lanes) + $5,500,000 (bus lanes) = $10,450,000
Additional costs
Labor: 20% of total construction cost = 0.20 * $10,450,000 = $2,090,000
Design and engineering: 10% of total construction cost = 0.10 * $10,450,000 = $1,045,000
Equipment and materials: 30% of total construction cost = 0.30 * $10,450,000 = $3,135,000
Other expenses: 10% of total construction cost = 0.10 * $10,450,000 = $1,045,000
Total project cost
Total project cost = Total construction cost + Additional costs
= $10,450,000 + ($2,090,000 + $1,045,000 + $3,135,000 + $1,045,000)
= $10,450,000 + $7,315,000
= $17,765,000
According to the National Safety Council, the comprehensive cost of a fatality is approximately $1.8 million, and the comprehensive cost of a serious injury is approximately $300,000. Important note: The value of a life lost or injured cannot be quantified.
Total fatalities on City of Austin-owned roadways over past five years = 22 + 33 + 26 + 35 + 28 = 144
Using the rule of thumb that five times the number of fatalities are seriously injured: Total seriously injured over five years = 5 * 144 = 720
Now, let's calculate the total crash costs associated with fatalities and serious injuries:
Total crash costs for fatalities = 144 * $1.8 million
Total crash costs for serious injuries = 720 * $300,000
Total crash costs for fatalities and serious injuries:
Total crash costs for fatalities = 144 * $1.8 million = $259.2 million
Total crash costs for serious injuries = 720 * $300,000 = $216 million
Calculate the combined total crash costs:
Combined total crash costs = Total crash costs for fatalities + Total crash costs for serious injuries = $259.2 million + $216 million = $475.2 million
Now, we have the combined total crash costs over the last five years in Austin.
Compare the total crash costs to the project cost:
Project cost = $17,765,000
Calculate the payback period:
Payback period = Project cost / Annual crash cost savings
To estimate annual crash cost savings, we need to consider the time frame over which these crash costs are incurred. Let's assume these costs are incurred annually:
Annual crash cost savings = Combined total crash costs / 5 years
Let's proceed with the calculations.
Apologies for the inconvenience; let's correct the calculation of the payback period.
Given:
Project cost: $17,765,000
Combined total crash costs over 5 years: $475.2 million
Calculate the annual crash cost savings:
Annual crash cost savings = Combined total crash costs / 5 years = $475.2 million / 5 years = $95.04 million per year
Calculate the payback period:
Payback period = Project cost / Annual crash cost savings = $17,765,000 / $95.04 million per year ≈ 0.187 years
The payback period is approximately 0.187 years, which is equivalent to approximately 2.24 months.